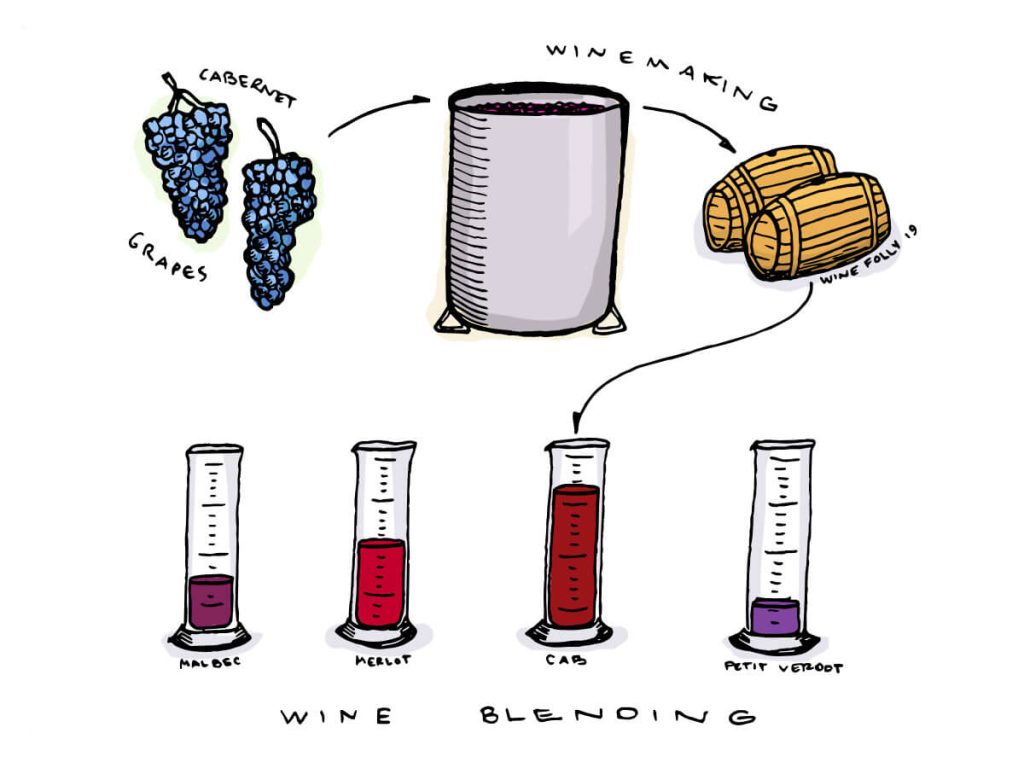
Designing an experiment to create a wholesome red wine blend using the composition spread approach can also be applied in the wine industry, specifically by blending different grape varietals to explore flavor, aroma, and texture combinations. For this experiment, we’ll focus on blending Grenache, Syrah, and Mourvèdre—a classic trio used in Rhône-style red wines.
Experimental Design: Composition Spread Approach for Red Wine Blending
Objective:
To identify the optimal blend of Grenache, Syrah, and Mourvèdre that results in a balanced red wine with desirable sensory characteristics (aroma, flavor, body, tannins, etc.).
Step 1: Selection of Varietals
- Grape Varietals:
- Grenache (G): Known for fruity, berry flavors, and a lighter body. It contributes sweetness, fruitiness, and alcohol.
- Syrah (S): A full-bodied grape that adds spiciness, tannins, and dark fruit flavors.
- Mourvèdre (M): Offers earthy, gamey notes with structure and tannins, often used to give wines depth and aging potential.
- Desired Wine Profile: A balanced red wine with complexity, good structure, moderate tannins, and a harmonious blend of fruit and spice.
- Portions of this description document were generated/assisted by ChatGPT 4o.
Step 2: Design of the Composition Spread
- Blending ratios: Create a composition spread where the percentages of Grenache, Syrah, and Mourvèdre vary gradually across a range of blends.
- Grenache (G), Syrah (S), and Mourvèdre (M) can each range from 0% to 100%, ensuring every possible combination is represented.
- Example:
- G-S-M: 50%-30%-20%, 40%-40%-20%, 60%-20%-20%, etc.
- This spread should allow for exploration of different ratios and their effects on sensory characteristics.
Step 3: Grid Design for Sampling
Set up a grid of blend ratios to systematically sample and test. For example, create a triangular grid of different blending ratios for Grenache (G), Syrah (S), and Mourvèdre (M), using a 10×10 matrix for a range of compositions:
- Grenache (G): 0% to 100%
- Syrah (S): 0% to 100%
- Mourvèdre (M): 0% to 100%
Each grid point represents a different blend. For example:
- Grid point (1): G60%-S20%-M20%
- Grid point (2): G40%-S40%-M20%
- Grid point (3): G50%-S30%-M20%
Step 4: Experimental Wine Blending
- Small-scale fermentation: Blend small amounts of wine (using base wines from each varietal) according to the predetermined ratios.
- Each blend can be prepared in small vessels to match the grid points, ensuring each blend has a precise combination of Grenache, Syrah, and Mourvèdre.
- Allow time for the blends to homogenize and integrate before sensory analysis.
Step 5: Sensory and Chemical Analysis
Conduct both sensory analysis and chemical analysis for each blend to understand how different compositions affect the final wine.
Sensory Evaluation (using a professional tasting panel):
- Aroma: Evaluate for fruitiness, spiciness, earthiness, and complexity.
- Flavor: Assess for balance of sweetness, acidity, tannins, and body.
- Mouthfeel: Evaluate texture, tannin structure, and finish.
- Overall balance: Determine how well-integrated the components are, including harmony between fruit, alcohol, and structure.
Chemical Analysis:
- pH and Acidity: Measure total acidity and pH to assess how different blends affect the wine’s freshness and structure.
- Alcohol content: Check alcohol levels to ensure balance and ensure certain blends are not overpowering or too light.
- Tannins and Polyphenols: Analyze tannin levels to understand how the blend influences mouthfeel and potential for aging.
- Color intensity: Measure color to evaluate how the blends differ in intensity (important for visual appeal).
Step 6: Data Analysis and Mapping
- Mapping blend ratios to sensory outcomes: Plot the sensory and chemical data against the blend composition using tools like heatmaps or 3D plots.
- Ternary diagrams**:** Show how flavor profiles (e.g., fruitiness, body, and tannins) vary across the range of Grenache, Syrah, and Mourvèdre compositions.
- Identify key blends: Use data analysis to identify the most promising blends based on sensory preferences (e.g., blends with the best balance of body, aroma, and tannin structure).
Step 7: Refinement and Validation
- Refining blend ratios: Once promising blends are identified, experiment with fine-tuning the exact ratios in smaller steps (e.g., a 55%-25%-20% blend if 60%-20%-20% was promising).
- Re-blend at larger scales: After identifying optimal ratios, perform larger batch blending and repeat sensory analysis for consistency.
- Additional adjustments: Based on tasting feedback, adjust factors like barrel aging or acidity to further optimize the wine’s characteristics.
Diagram: Ternary Composition Spread Layout
Here’s a conceptual layout of how the wine blend ratios can be varied and mapped onto a triangular plot:
G (100%)
/ x\
/ x \
/ x \
/ x \
/ x x \
/__________\
S (100%) M (100%)
Each point inside the triangle represents a unique blend of Grenache (G), Syrah (S), and Mourvèdre (M). The tasting panel can evaluate each blend’s sensory profile and plot it according to the desired balance.
Step 8: Conclusion
This composition spread approach allows winemakers to systematically explore a wide range of blend ratios between Grenache, Syrah, and Mourvèdre, optimizing for the best balance of flavor, aroma, body, and structure. The high-throughput analysis can accelerate the discovery of an ideal blend, refining the process for crafting a balanced and appealing red wine.
APPENDIX A
MODELING IN PANMO CONFAB
Step A: Design of Experiments using Generative AI

Step B: GenAI Steps for Process Flow (recommended)

Step C: GenAI Steps for Process Flow (created)

Step D: Creation of Design of Experiments


Step E: GSM Blend Observational Study

Step F: Analysis


Better aromas are in higher numbers (5+) in the bottom right of the triangle; three axes indicate the proportions of the blended G, S, M components.
Leave a Reply