Published: Tue, Feb 27th, 2024.
We present a study of plasmonic nanoapertures coupling to optical mode using the DOE study and identify the factors of significance for this study.
The science of plasmonics enables capturing light wave oscillations in a metal-semiconductor interface as plasmon oscillations and allows information processing at fraction of light wavelength; a Plasmonic Nanocavity utilizes these effects to shape photon mode for coupling plasmonic mode to photonic mode or vice versa.
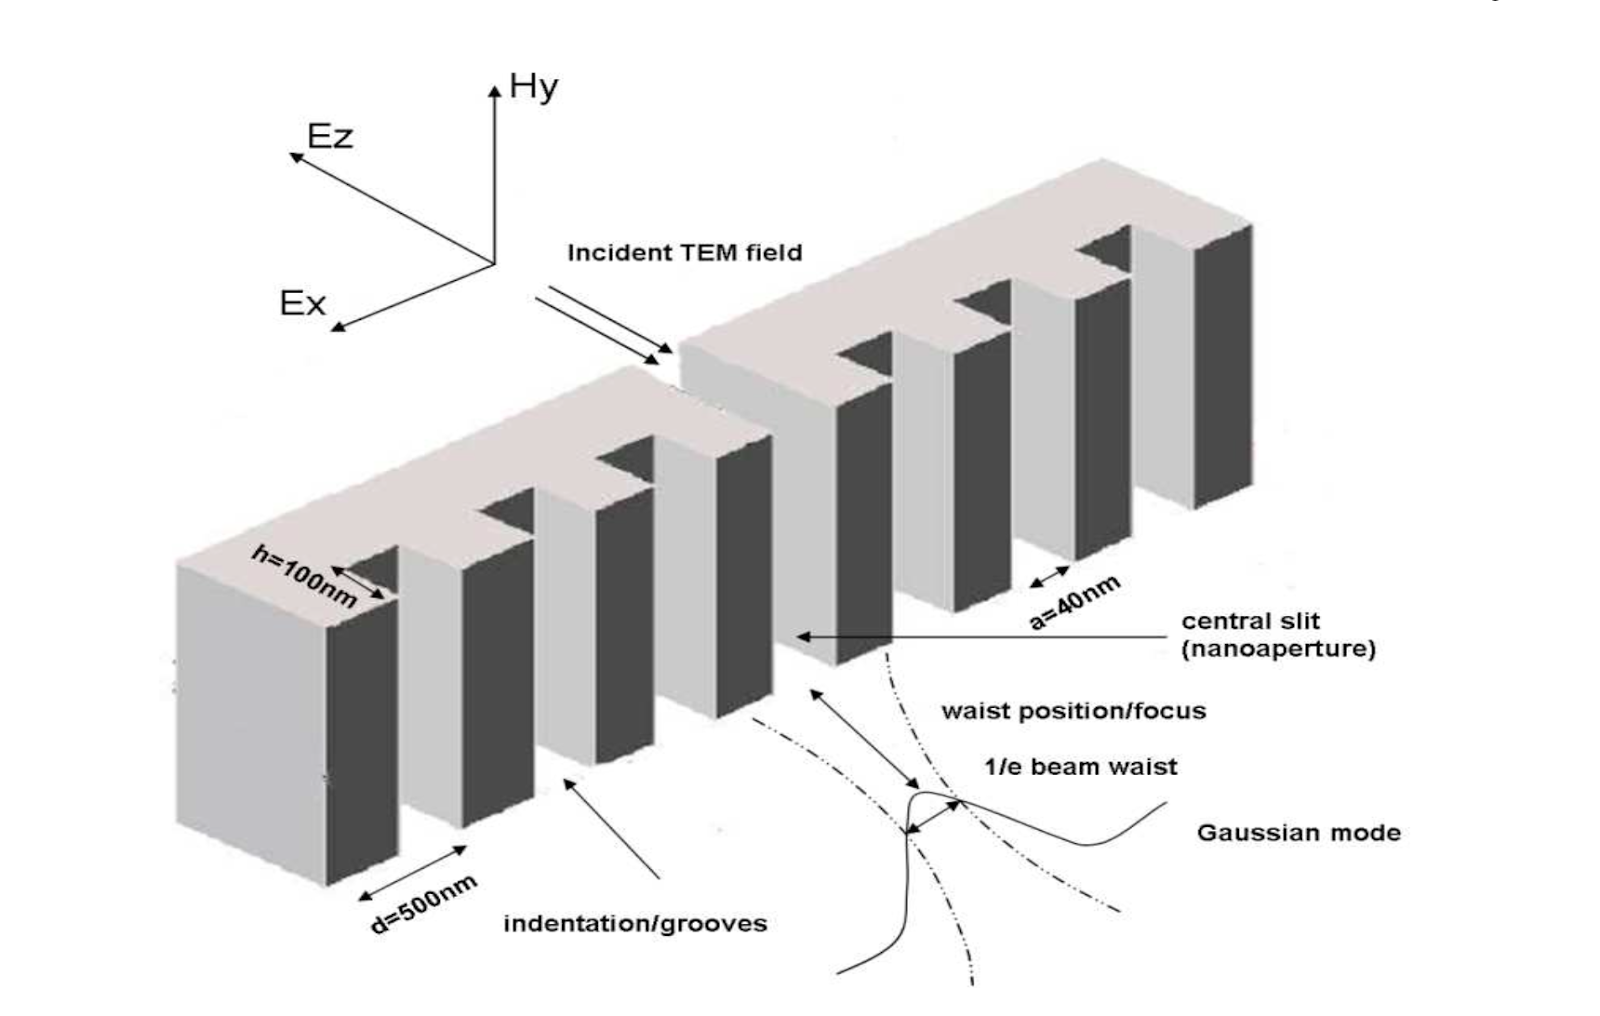
Fig. 1: Plasmonic nanocavity considered as part of this study [1]
Problem Statement
We want to find out the geometric parameters of nanocavity (factors interest) and their significance to increase (maximize) the coupling of light into the fundamental optical mode from plasmonic nanocavity. We would like to study the periodicity (d), height (h) and slit width (a)eeffects on the coupling to the optical mode and identify their precedence.e
Method
We choose a simple full-factorial study and use the computer solver for modeling the physics to compute coupling strength;
Factors and Levels
• N , number of grooves/indentations on either side of the central aperture
- N = [8, 9, 10, 11, 12, 13, 14, 15, 16]
• h , depth of the groove/indentation
- H = [30.1, 206.1] nm
• a , central slit and groove width
- A = 40nm (fixed)
• d , periodicity of grooves
- D = [200, 800] nm
DOE Design 1
The first DOE design has 9x2x1x2 = 36 runs without replication,
| N | d (nm) | h (nm) |
| 8 | 800 | 206.1 |
| 9 | 800 | 206.1 |
| 10 | 800 | 206.1 |
| 11 | 800 | 206.1 |
| 12 | 800 | 206.1 |
| 13 | 800 | 206.1 |
| 14 | 800 | 206.1 |
| 15 | 800 | 206.1 |
| 16 | 800 | 206.1 |
| 8 | 200 | 30.1 |
| 9 | 200 | 30.1 |
| 10 | 200 | 30.1 |
| 11 | 200 | 30.1 |
| 12 | 200 | 30.1 |
| 13 | 200 | 30.1 |
| 14 | 200 | 30.1 |
| 15 | 200 | 30.1 |
| 16 | 200 | 30.1 |
| 8 | 200 | 206.1 |
| 9 | 200 | 206.1 |
| 10 | 200 | 206.1 |
| 11 | 200 | 206.1 |
| 12 | 200 | 206.1 |
| 13 | 200 | 206.1 |
| 14 | 200 | 206.1 |
| 15 | 200 | 206.1 |
| 16 | 200 | 206.1 |
| 8 | 800 | 30.1 |
| 9 | 800 | 30.1 |
| 10 | 800 | 30.1 |
| 11 | 800 | 30.1 |
| 12 | 800 | 30.1 |
| 13 | 800 | 30.1 |
| 14 | 800 | 30.1 |
| 15 | 800 | 30.1 |
| 16 | 800 | 30.1 |
The solver responses are captured in a schem like the following, 
Responses
The responses are peak transmission T, the wavelength λ (nm), where this occurred, and total transmission T0.
The design is performant at this response wavelength λ of the TM-field incident on nanoaperture.
Blocking and Replication
Since the experiment is done via the simulator which doesn’t have any stochastic effects in the model we avoid replication.
We block the designs in a second set of DOE by the depth at 1000nm or 200nm.
DOE Design with Blocking by Depth
| Blocking by depth= 800 | ||
| N | d (nm) | h (nm) |
| 6 | 800 | 206.1 |
| 7 | 800 | 206.1 |
| 1 | 800 | 212.1 |
| 2 | 800 | 210.1 |
| 3 | 800 | 206.1 |
| 4 | 800 | 206.1 |
| 5 | 800 | 204.1 |
| Blocking by depth= 200 | ||
| N | d (nm) | h (nm) |
| 0 | 200 | 10.1 |
| 1 | 200 | 50.1 |
| 2 | 200 | 40.1 |
| 3 | 200 | 36.1 |
| 4 | 200 | 34.1 |
| 5 | 200 | 32.1 |
| 6 | 200 | 32.1 |
| 7 | 200 | 30.1 |
DOE Table with responses in PanMo Confab™ tool
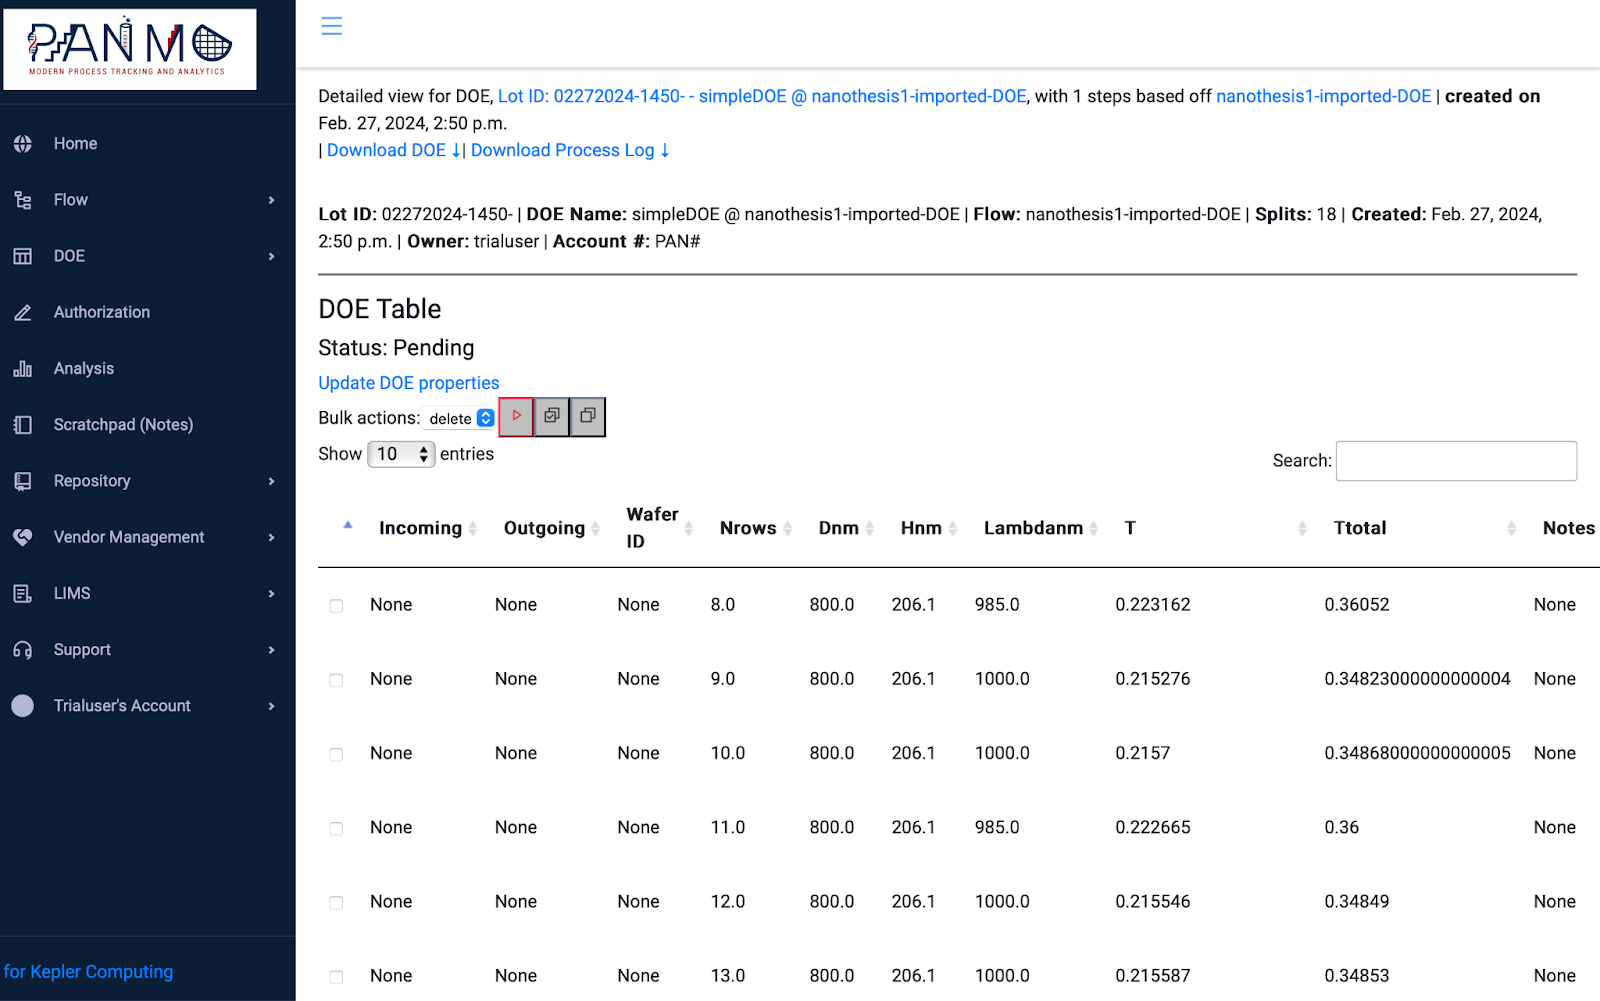
Fig 1.2: DOE Responses Table in Panmo Confab, www.panmo.cloud
Results
Results from the first DOE are shown as follows, where the low performing (transmission < 0.1) 16 runs are eliminated,
DOE Response DOE Design 1
| N | d (nm) | h (nm) | λ (nm) | T | Ttotal |
| 8 | 800 | 206.1 | 985 | 0.223162 | 0.36052 |
| 9 | 800 | 206.1 | 1000 | 0.215276 | 0.34823 |
| 10 | 800 | 206.1 | 1000 | 0.2157 | 0.34868 |
| 11 | 800 | 206.1 | 985 | 0.222665 | 0.36 |
| 12 | 800 | 206.1 | 1000 | 0.215546 | 0.34849 |
| 13 | 800 | 206.1 | 1000 | 0.215587 | 0.34853 |
| 14 | 800 | 206.1 | 1000 | 0.215525 | 0.34849 |
| 15 | 800 | 206.1 | 1000 | 0.215574 | 0.34852 |
| 16 | 800 | 206.1 | 1000 | 0.215544 | 0.3485 |
| 8 | 200 | 30.1 | 225 | 0.404 | 0.80397 |
| 9 | 200 | 30.1 | 225 | 0.405 | 0.8027 |
| 10 | 200 | 30.1 | 225 | 0.405 | 0.79953 |
| 11 | 200 | 30.1 | 225 | 0.405 | 0.79794 |
| 12 | 200 | 30.1 | 225 | 0.406 | 0.79842 |
| 13 | 200 | 30.1 | 225 | 0.407 | 0.7996 |
| 14 | 200 | 30.1 | 225 | 0.407 | 0.80011 |
| 15 | 200 | 30.1 | 225 | 0.407 | 0.79983 |
| 16 | 200 | 30.1 | 225 | 0.406 | 0.79943 |
DOE Response Blocking DOE Design 2
| Blocking by Depth = 800nm | |||||
| N | d (nm) | h (nm) | λ (nm) | T | Ttotal |
| 1 | 800 | 212.1 | 1000 | 0.140276 | 0.30185 |
| 2 | 800 | 210.1 | 1000 | 0.191541 | 0.3212 |
| 3 | 800 | 206.1 | 1000 | 0.213802 | 0.34223 |
| 4 | 800 | 206.1 | 1000 | 0.22066 | 0.35318 |
| 5 | 800 | 204.1 | 1000 | 0.222854 | 0.36033 |
| 6 | 800 | 206.1 | 1000 | 0.214094 | 0.34692 |
| 7 | 800 | 206.1 | 1000 | 0.216476 | 0.34927 |
| Blocking by Depth = 200nm | |||||
| N | d (nm) | h (nm) | λ (nm) | T | Ttotal |
| 0 | 200 | 10.1 | 200 | 0.0646 | 0.84326 |
| 1 | 200 | 50.1 | 280 | 0.179 | 0.65325 |
| 2 | 200 | 40.1 | 250 | 0.277 | 0.71049 |
| 3 | 200 | 36.1 | 240 | 0.341 | 0.73555 |
| 4 | 200 | 34.1 | 235 | 0.376 | 0.75492 |
| 5 | 200 | 32.1 | 230 | 0.394 | 0.77363 |
| 6 | 200 | 32.1 | 230 | 0.4 | 0.78314 |
| 7 | 200 | 30.1 | 225 | 0.402 | 0.79992 |
Discussion
The DOE helped us identify the peak wavelengths quicker than a uniform grid scan, and reduced the search space.
The DOE indicates the number of grooves N > 3 have same peak transmission independent of wavelength.
DOE Response Fitting
Model was fit to Transmission as a function of periodicity d, height h, and number of grooves N, with 2-level interactions at high degree of confidence:
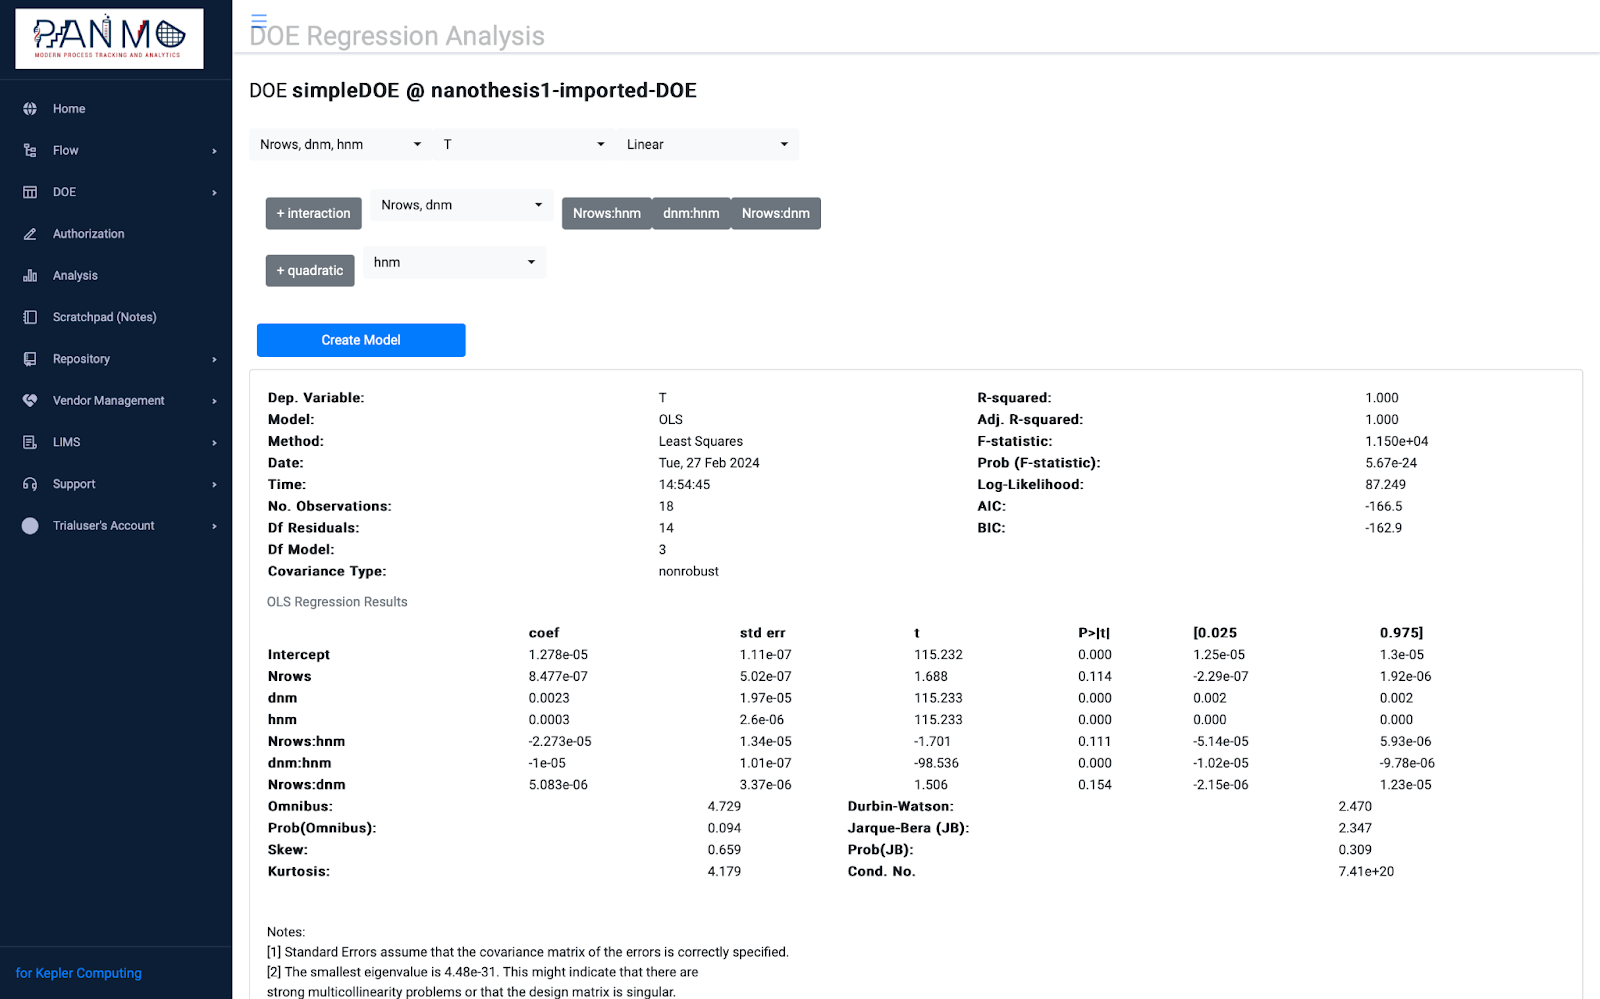
Fig. 2: Model response fit to Transmission coupling factor is T = 1e-5 + 8.47e-7*N + 0.0023*dnm + 0.0003*hnm – 2e-5*N*hnm – 1e-5*hnm*dnm + 5e-6*Nrows*dnm
The Blocking DOE indicates that wavelength to period of corrugation has a correlation with peak transmission.
The order of importance of the factors determined by the DOE software [2] are the following,
- Periodicity (d)
- Depth (h)
- Number of grooves (N)
This is validated by the model fit in Fig .2. where the linear model plus interaction of depth and periodicity fit the response correctly.
Mean effects Charts indicates changes in periodicity d, or depth h, have largest impact on the transmission, while the change in number of grooves is nominal beyond N > 3:
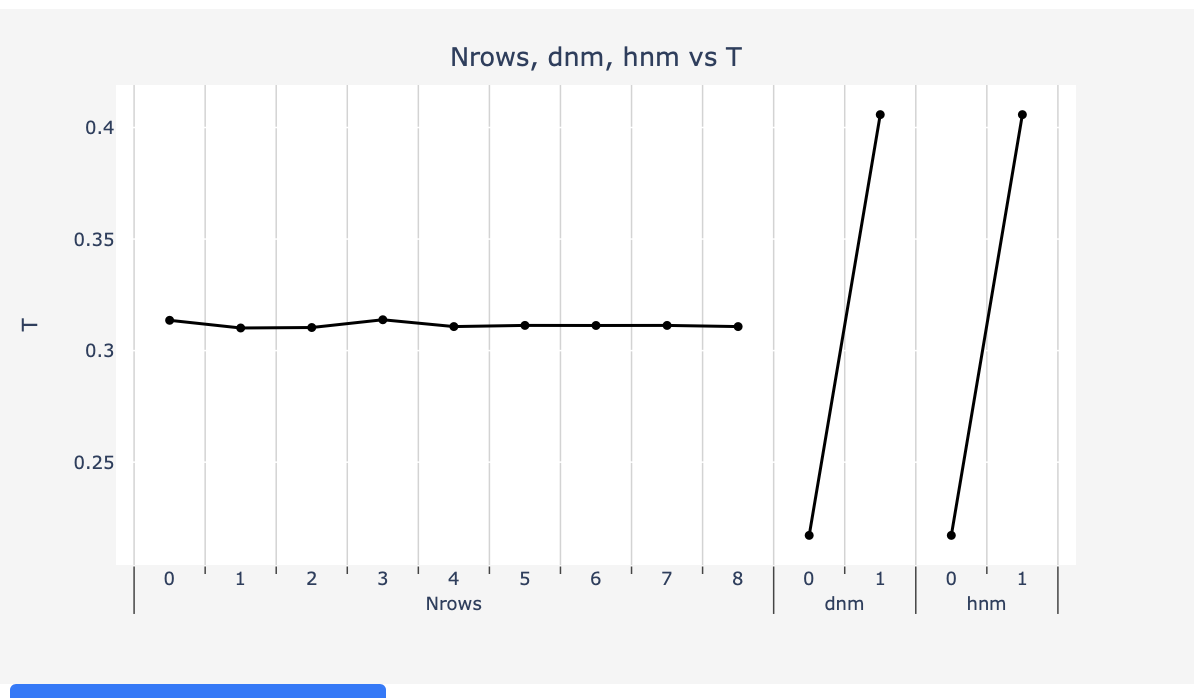
Fig 3: Mean effects plot for depth, height and Nrows
References
- Annamalai, M. (2007). Optimization of coupling from a sub-wavelength metal nanoaperture to a Gaussian mode. The University of Texas at Arlington.
- Panmo Confab™ DOE and Process Flow Software, www.panmo.cloud (accessed Feb, 2024)
- This DOE design is based on the M.S. thesis work done by the author at University of Texas at Arlington, in 2007. For more details contact: muthu@panmo.cloud